 When social media arrived, it was something of a game changer. If you’ve been reading our recent posts on social media, you’ll already know that social media has been such a huge success because it is engaging. Its ability to engage the audience stems from how it supports imagery of various types. YouTube, Instagram, Twitter, and Facebook all support imagery, which is the main reason why they are so engagement-centric and hence popular.
Infographics are based on the same principle i.e. blending imagery with text. Therefore, if you have a digital media strategy, then it might be a good idea to incorporate infographics into its social media component. To do this, however, you’ll need to learn to create your own infographics. This is precisely where we step in. Here’s a step by step guide that will help you create your own infographics.
Create Your Own Infographics Step 1: Determine What Type of Infographic You’ll Be Making
 Essentially, there are two types of infographics that you can create and both of them are distinct from each other in their own way. These are branding infographics and editorial infographics. As their name suggests, the first tries to inform people about the company and establish goodwill for it amongst its target audience. The other, however, is more nuanced. Its purpose is to tell a story of some kind. It will gradually build up to its final point through various statistics and nuggets of information.
The clearest difference between branding and editorial infographics is that the former will talk about nothing but the business or brand in question, while the latter will actually only mention the company or brand at the end in small font. Both these types of infographics serve different purposes. This means that the very first thing you need to do is define the reasons why you want to create your own infographics and then see which type of infographics fits those reasons.
Create Your Own Infographics Step 2: Formulate a Roadmap
 A building will only stand on a solid foundation. Without such a foundation, the building will not stand any type of scrutinising element and topple immediately. Every type of content is the same and that includes infographics. Therefore, one of the key lessons of learning to create your own infographics is to learn to value groundwork.
When you try to create your own infographics, doing the groundwork translates into creating an outline for the entire project. This means establishing all the key aspects of the project such as the overarching message or conclusion, the target audience, various slides or sections of the infographic, and even more basic things such as the size and format of the infographic.
In simple words, this roadmap will define your final destination and the route you’re going to take to reach that destination.
Create Your Own Infographics Step 3: Collect and Make Sense of All the Information
 If you know what your destination will be, then you can go about gathering all the resources to get there. When you create your own infographics, this means collecting all the information you can possibly need and then sorting through it. The information you collect will be defined by what type of infographic you’re looking to create. The way you deal with the said information will also depend on the type of infographic you’ve chosen. For instance, you will prioritise huge contracts and excellent reviews in branding infographics but choose demand related statistics or even changing trends in editorial infographics.
The fundamental premise here is that after you’ve collected the requisite information, you’ll have to make sense of it. Where you collect the information from also depends on what kind of infographic you’re targeting. If you’re looking at branding, then you’ll look at internal events such as launches, reviews, sales and profit figures, huge contracts, and company-specific statistical achievements. On the other hand, if you’re looking at editorial infographics, you’ll have to look at researches, surveys, and studies which can either be internally or externally sourced.
Needless to say, your chosen editorial infographic data needs to amount to a story for the viewer, while your chosen branding infographic data needs to amount to improved perspective of your business in the eyes of the viewer.
Create Your Own Infographics Step 4: Utilise a Wireframe and a Mood Board For The Sake Of Coherence
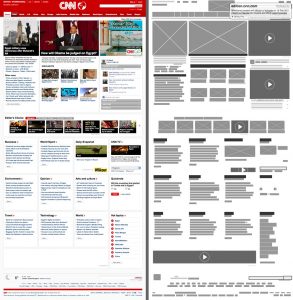 When you create your own infographics, you’ll realise one thing very quickly. Designing is as important in infographics as content is. You may have top class content but it will amount to nothing without proper designing. This is why you need to ensure that design elements are well taken care of in your infographics. To do this, you should try to incorporate some basic designing techniques that help structure the process i.e. wireframes and mood boards. Wireframes are used for any number of objects ranging from websites and newspapers to brochures and infographics. They are like rough layouts of how the final object will look with spaces being designated to images, headlines, body text, and other similar content elements.
Mood boards are used to see how various colours, shapes, and structures look together. These boards aren’t all that different from architects and decorators creating boards with pictures of fixtures along with wall colours and carpet samples to see how they all fit in. In the case of infographics, you’ll be creating a similar board containing all the design elements. Both wireframes and mood boards make it easy for you to visualise the end result when you create your own infographics.
Create Your Own Infographics Step 5: Design, Revise, Redesign, & Review
 Once you have a suitable wireframe and have finalised a mood board, you can go about placing all the design elements in their designated spaces. It is worth mentioning that even though you’ve determined what content you’ll be using and where you’ll be placing it with respect to all design elements, your infographic will still require a lot of polishing.
You’ll need various design elements to blend in with each other and this means adding effects and changing things around as and when required. In fact, despite the wireframe and mood board, you’ll probably end up revising your design, redesigning the output and then reviewing it a few times. In simpler words, you’ll only arrive at your final infographic after going through a number of its iterations.
Create Your Own Infographics Step 6: Launch Your Baby
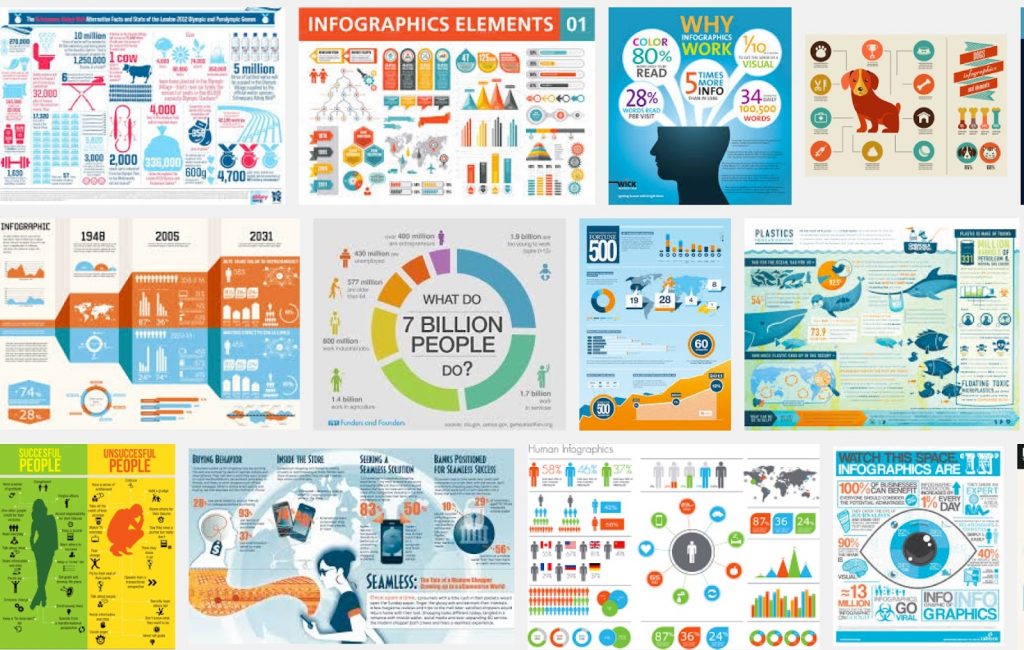 The purpose of most infographics is to draw people into the idea or story they’re trying to tell. With branding infographics, this means making people aware of the business’s achievements to a point where they remember the brand name or business name. In editorial infographics, this will mean telling the chosen story to the viewers with the aim of ensuring that they remember the conclusion. Typically, these conclusions are beneficial for the business’s sales and profits indirectly.
Since the purpose of all infographics is engagement, you can’t just tack it on somewhere and expect it to draw people, by itself. Therefore, after you create your own infographics, you’ll need to launch it in the right manner to ensure that it takes hold. For this, you’ll have to promote the infographic on your blog, your website, and your social media pages.
Leave a Reply